Your Prompt Cache Reads Zero and Your Prefix Is Fine

Every guide to Anthropic prompt caching tells you the same debugging step, and it is a good one.
If cache_read_input_tokens comes back zero across repeated requests with an identical prefix, something in that prefix is changing between calls. A timestamp in the system prompt. A UUID. A dict that serializes in a different key order. A tool list you rebuild each time. Find the byte that moved and the cache starts working.
I want to describe a case where the prefix was byte-identical, every request read zero, and nothing was wrong.
The setup
I have a project that submits repeated-measurement work through the Message Batches API. Same large prefix, several requests, one batch. Batches run asynchronously at half price, which makes them the obvious home for anything that is not latency-sensitive.
The interesting question was whether requests inside a single batch share the cache. If they do, the first request pays to write the prefix and the rest read it. On a large prefix that is most of the bill.
So I measured it. Three requests, identical prefix, one messages.batches call.
Two of them wrote the cache. The third read it — a full prefix read, not a partial one.
That is the answer you want. I wrote it down, and I wrote down a caution with it: one batch of three is one observation, not a guarantee about batch scheduling.
That caution turned out to be the only load-bearing sentence in the note.
The run that reversed it
Twelve days later, the same shape of batch — three requests, same identical prefix — came back with all three at cache_read_input_tokens = 0.
Every request wrote. Nobody read.
By the standard diagnosis this means the prefix moved. It had not. Same code path, same prefix construction, nothing in it derived from a clock or a UUID.
The two outcomes were different, but the records I kept do not include per-request start times. They show the reversal, not its cause.
What that means
A cache entry has to be written before it can be read. Anthropic documents batch requests as independently processed and says a cache entry becomes available only after the first response begins. That makes scheduling overlap a plausible explanation for the two outcomes, not a cause these measurements prove.
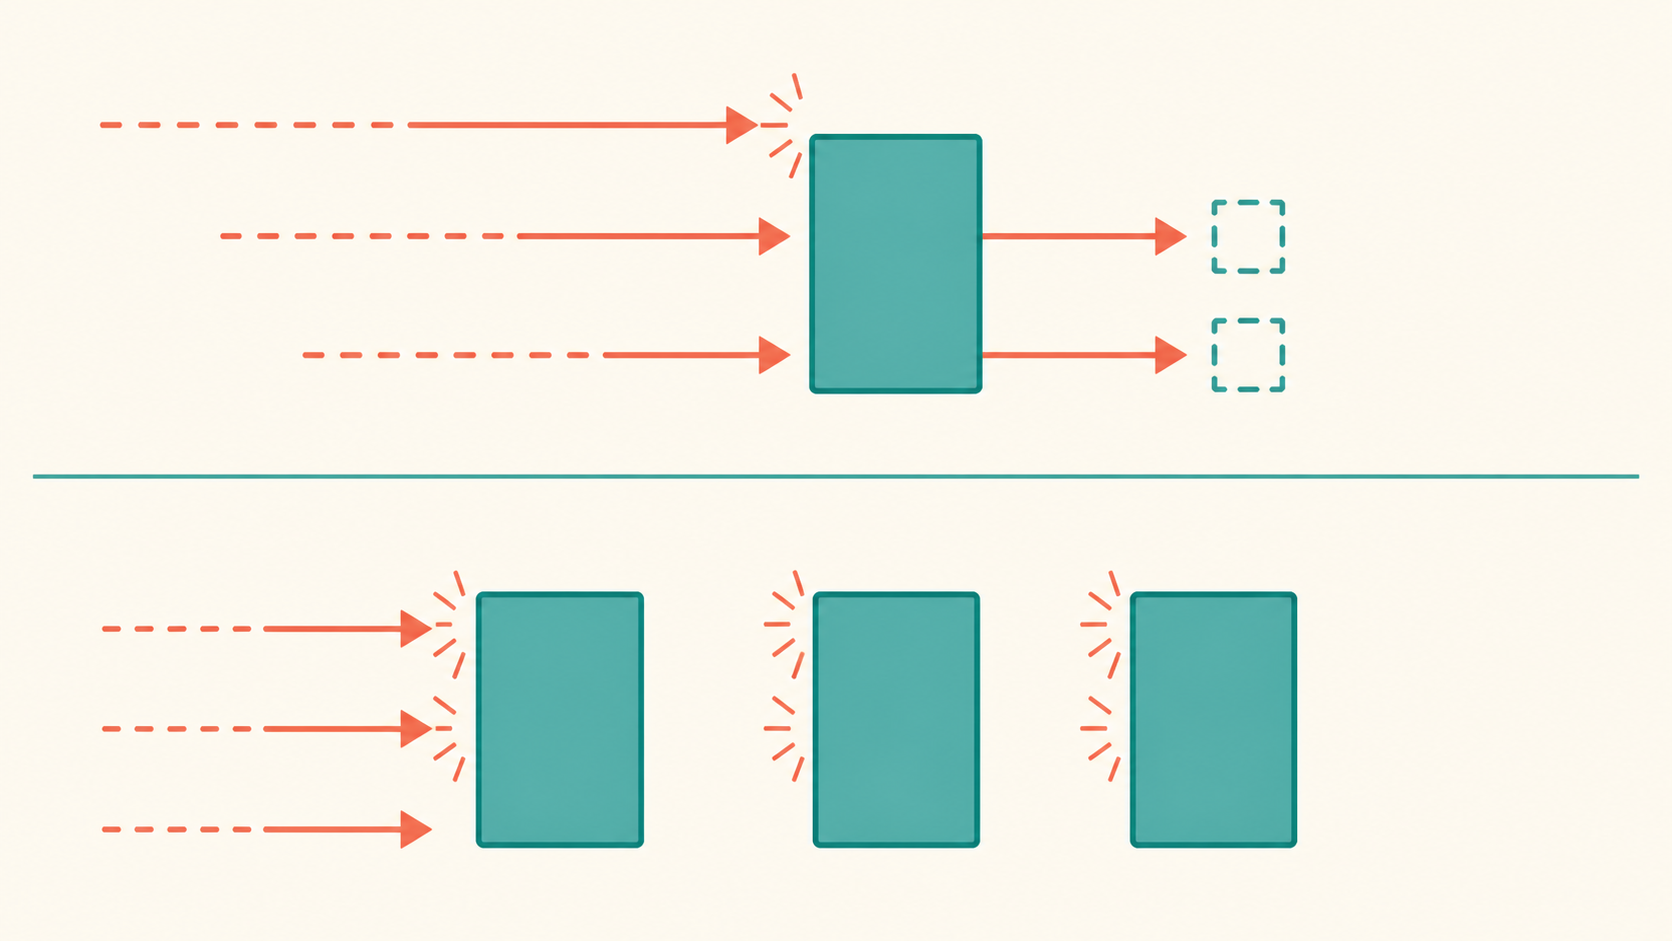
Cache sharing inside a batch is therefore not a property you can assume. It can occur when one request reaches the cache first and later work can read it, but the batch API does not give you control over that ordering.
Notice the shape of the mistake. My first measurement was real, but it recorded one outcome rather than a platform guarantee. The only reason I caught the overreach is that I had written down that it was one observation.
The practical rule: budget a repeated-measurement batch as if every request writes the full prefix. If you get sharing, it is a discount, not a plan. And if you are comparing two runs on cost, check whether they took the same wall-clock time in the queue before you attribute the difference to anything you changed.
The other place the numbers lie
While chasing this I hit a second accounting trap in the same API, and it is the more common one.
A request's prompt size is not input_tokens. It is three fields added together:
input_tokens
+ cache_creation_input_tokens
+ cache_read_input_tokens
input_tokens is the uncached remainder — the part of the prompt that was neither written to nor read from cache. When you have a large cached prefix, that remainder is a small fraction of what you actually sent. In the case I measured it was roughly a tenth.
The failure mode this produces is specific and very convincing. You load a large corpus into the prefix, run a request, check input_tokens to confirm the corpus went in, and see a number small enough that it looks like the corpus never loaded. Caching worked perfectly and the field named "input tokens" told you the opposite, because it excludes exactly the part you were checking for.
For measuring corpus size before a call, messages.countTokens is the separate endpoint that exists for it. This project's spec had carried 55,800 tokens as a corpus size; that figure was a one-character-equals-one-token upper bound that nobody had ever measured. The measurement at the time came back 65,896 — the "upper bound" was under the real number. (The corpus has since grown to 337 items and now measures 228,051, so do not read those two figures as a before-and-after of the same thing. They are not.)
Both of these are the same mistake
A wrong number does not raise an exception. It comes back tidy, plausible, and low.
input_tokens is a real field with a real meaning; it just does not mean "how big was my prompt." A batch that shared cache is a real observation; it just does not mean "batches share cache." In both cases the reading was arithmetically fine and the conclusion was wrong, and there was no error anywhere to tell me.
Three things I would keep:
Count with the field that owns the quantity. If you want prompt size, add the three usage fields or call countTokens. If you want to know whether caching is helping, look at cache_read_input_tokens specifically, not at the total.
Write down the sample size next to the conclusion. "Three requests in one batch shared a prefix" and "batches share prefixes" are different claims. The first one aged fine.
When a measurement reverses, look for what varied that you were not recording. Here it was queue wall-clock, which was in the batch metadata the whole time and which I had never once looked at, because it was not part of the thing I thought I was measuring.
These numbers are from one project on the Anthropic Message Batches API and I have not tried to reproduce the stagger deliberately — I am not sure it can be. If you have found a way to force it, I would like to know.
Get the next post.
If you made it to the end, meet the next post in your inbox or RSS reader.